|
This special issue
includes a selection of papers from SCCG 2004 conference chaired by Prof.
Alexander Pasko (Hosei University, Tokyo). The Spring
Conference on Computer Graphics is the oldest annual event in Central Europe and the
proceedings are later published by ACM SIGGRAPH. This is possible thanks to
the fruitful combination of high quality contributions and generous
sponsoring from HP Invent Slovakia. The conference
celebrated 20th anniversary in 2004. More details can be found at www.sccg.sk.
|
|
There are two
competitions organized during the conference � SCCG Best Papers and SCCG Best
Presentations. They are based on evaluation by reviewers and public voting of
SCCG participants. Awarding of winners is a part of closing ceremony and the
diplomas with logos of sponsors are available at www.sccg.sk,
as well. As proposed
by Alexander Pasko and accepted by the editor-in-chief, Prof. Victor V. Pilyugin,
the winning papers are published in special issue of CGG, a prominent online
journal at http://elibrary.ru/cgg. The papers are
slightly extended and rewritten, based on SCCG discussions and inspirations.
After completing the selection, one can see that the unifying idea of all
five papers awarded can be formulated as discovering the tricky solutions
between speeding-up (modeling) and rendering quality criteria.
William Van Haevre et al. dealt with ray
density estimation for plant growth simulation. In particular, they evaluated
the varying indoor environment illumination while growing the plants using
intensity-modified rules for L-systems. The novel approach results in a
flexible and accurate algorithm to achieve more realistic vegetation. The
paper won the 3rd Best Presentation Award.
Mario Sormann et al. focused on a
solution of a complex task � creating models from image sequences as fast and
as good as possible. VR modeler is a novel interactive monocular 3D modeling
system with nicely separated intelligent 2D interaction and 3D
reconstruction. Besides that, the coarse and detailed precision of urban
models is supported for web presentation and other purposes. The results
already contributed to Virtual Heart of Central
Europe (www.vhce.info) which is a recent
European cultural heritage project.
The paper won the 3rd Best Paper Award.
|

|
|
Rui Rodrigues and Antonio Ramires Fernandes
report on prospective use of graphics cards. A significant part of 3D
reconstruction, especially epipolar
geometry computations, can be transferred into the GPU. This new idea offers
a remarkable gain up to two orders of magnitude in terms of computational
times. The paper won the 2nd Best Presentation Award.
|
|
Ivan Viola et al.
explored frequency domain volume rendering (FVR) because of computational
speed. Moving significant parts of computations to GPU, they report
acceleration by factor of 17. This allows for highly interactive framerates with varying
rendering quality. The quality depends on interpolation schemes. The authors
analyzed four of them to clarify the trade-off between performance and
quality. The paper won the 2nd Best Paper Award.
|
|
Last but not
least, Diego Gutierrez et al. contributed by a SIGGRAPH quality paper on
global illumination for inhomogeneous media. In total, there are 10 different
light-object interactions known and we simplify the model to achieve faster
solutions. The authors noticed that light rays travel a curved path while
going through inhomogeneous media where the index of
refraction is not constant. In addition, they took into account the way how
human perception deals with luminances.
In total, the phenomena like sunset, green flash, and bleaching are mastered to complete an
excellent research and a brilliant presentation. This is why only five papers
are here � Diego clearly won in both competitions.
|
|
For conclusion, I
have to recall the following. In 2003, one year ago, this message from
Alexander Pasko arrived
to Budmerice Castle:
|
|
�Dear participants and
organizers of SCCG, your conference provides unique opportunity for young
researchers to make their efforts visible in the world, especially for those
who are not hypnotized by the visual quality of modern computer graphics
works in modeling, rendering, and animation. We all know that such a work
still requires tedious manual labor hampered by errorneous models and algorithms. Let us hope that
the next spiral of development will make our work in computer graphics more
close to a joyful mind game.�
|
|
I have to thank again to Alexander and to all
people who contributed to SCCG 2004 in the spirit of these beautiful and
clever words.
|
|
Andrej
Ferko
Comenius University Bratislava, SK-842 48
Bratislava, Slovakia, [email protected], www.sccg.sk/~ferko
|
Physically-based behavior of light in the atmosphere
Diego Gutierrez,
University of Zaragoza, Zaragoza, Spain
[email protected]
Francisco J. Seron,
University of Zaragoza, Zaragoza, Spain
[email protected]
Oscar Anson,
University of Zaragoza, Zaragoza, Spain
[email protected]
Adolfo Mu�oz,
University of Zaragoza, Zaragoza, Spain
[email protected]
Contents
Abstracts: Several natural phenomena, such as mirages or
the green flash, are owed to inhomogeneous media in which the index of refraction
is not constant. This makes the light rays travel a curved path while going through
those media. One way to simulate global illumination in inhomogeneous media is
to use a curved ray tracing algorithm, but this approach presents some problems
that still need to be solved. This paper introduces a full solution to the global
illumination problem, based on what we have called curved photon mapping, that
can be used to simulate several natural atmospheric phenomena. We also present
a model of the Human Visual System (HVS) to display images in a more realistic
way, taking into account how we perceive luminances in a real-world scene. This
is of special interest in the green flash effect, where some of the perceived
green is owed to bleaching of the photoreceptors in the human eye.
Key words: Rendering, global illumination, photon mapping, natural phenomena,
inhomogeneous media, realism
1. Light in the atmosphere
Several of the atmospheric effects we see in nature, from mirages to
the green flash, are owed to light traveling curved paths [Minnaert
1993], and therefore are impossible or exceedingly costly to simulate
with synthetic imagery using standard Monte Carlo ray tracing
techniques. Nevertheless, modeling of nature has been one of the most
ambitious goals of the Computer Graphics community.
Most ray tracing algorithms are based on the assumption that light rays
travel following a straight path. This is so because mentioned
algorithms consider only homogeneous media, where properties are kept
constant. While this assumption works well for a great number of
situations, it nevertheless imposes several restrictions on the scenes
and effects that can be reproduced, including some of the phenomena
that occur in our atmosphere.
Most of the media are in fact inhomogeneous to one degree or another,
with properties varying continuously from point to point. The
atmosphere, for instance, is in fact inhomogeneous since pressure,
temperature and other properties do vary from point to point, and
therefore its optic characterization, given by the index of refraction,
is not constant.
A light ray propagating in a straight line would then be accurate only
in two situations: either there is no media through which the light
travels (as in outer space, for instance), or the media are
homogeneous. But with inhomogeneous media, new phenomena occur. For
instance, light in warm air (which has a lower optical density) moves
faster than in cold air, which is denser.
According to Fermat�s Principle, light crossing a medium gets curved
towards the areas with the greater index of refraction. This index of
refraction, which defines the optical characteristics of the medium, is
a function of both humidity and density, as well as wavelength, with
density being a function of pressure and temperature itself. Therefore,
in a medium where temperature changes continually, so will the
direction of propagation, thus making light rays travel cu?rved paths
(with the degree of curvature being a function of wavelength).
2. Previous works
There are several
examples that simulate the behavior of light in the atmosphere, such as
the works of Musgrave [1993] or Nishita [1998]. There is also some
previous work on curved ray tracing in inhomogeneous media. Berger and
Trout [1990] recreate mirages by subdividing the medium into various
homogeneous layers, with a different index of refraction for each one.
Musgrave [1990] proposes a purely reflective model as the means of
forming mirages, while Groeller [1995] uses sources of nonlinearity
such as gravity centers, gravity lines, chaotic systems and parametric
curved rays. Stam and Languenou [1996] propose a solution by obtaining
the differential equation that describes the trajectory of the ray from
the equation of the light wave. Finally, Ser�n et al. [2002] describe a
more general method, free of the restrictions that appear in the above
papers regarding the dependences of the index of refraction, and
propose a partial solution to the problem using the general equation,
based on Fermat�s principle, that describes the phenomenon. None of
these works, though, can successfully follow the complete light paths:
from the lights through inhomogeneous media to interaction with
geometry, through inhomogeneous media again before finally reaching the
eye. The basic problem of following all these paths is explained in the
next section.
This paper describes a global illumination solution based on what the
authors call curved photon mapping techniques. The basic algorithm is
explained in the next section. Section 3 describes our curved photon
mapping solution. Our implementation of an Atmosphere Profile Manager
is explained in Section 4. The algorithm is validated through several
test images in Section 5, while Section 6 presents the green flash and
our work on the Human Visual System and the bleaching of photoreceptors
in the eye. The results are shown in Section 7, and the future work is
discussed in Section 8.
3. Curved photon mapping
Traditionally,
light travelling trough inhomogeneous media has been simulated by using
ray tracing techniques [Glassner 1989]. Basically, in backward ray
tracing, a ray is shot from the eye into the scene until it reaches an
object, and from that intersection point more rays are shot towards the
lights to find the color of the corresponding pixel.
This works well for homogeneous media, where the light rays travel in a
straight path. But the situation changes when using curved ray tracing:
curving the eye ray until it reaches an object in the scene is
conceptually simple. We do not know where each ray is going to end up
after being curved by the medium, but we do not care either, since it
will eventually hit some object or be lost in infinity, just as with
straight ray tracing. The problem arises when shooting additional rays
from the intersection point to the lights. Even though we know both the
start and end points of the ray, it is difficult to find a curve that
passes through those two points while also obeying the nonlinearity
caused by the inhomogeneous medium. Just shooting rays hoping one will
eventually hit the light is obviously very ineffective. This is a
problem similar to computing caustics by using path tracing or any
other backward ray tracing method. Caustics are concentrated light
reflections on diffuse surfaces caused by refraction through
transparent surfaces, and to simulate them in the image it would be
necessary to trace a random ray from a diffuse surface, and have the
ray interact with several specular surfaces and then hit the light.
Arvo [1986] first introduced forward ray tracing to simulate caustics,
while bidirectional path tracing [Lafortune and Willems 1996; Veach and
Guibas 1994] combines both backward and forward ray tracing by
generating some path vertices starting from the light sources and some
from the eye.
However, all these techniques would fail again (or be too
computationally expensive) in an inhomogeneous media. Shooting rays
from the objects to the eye in forward ray tracing, or obtaining shadow
rays in bidirectional path tracing would face the same basic problem as
with backward ray tracing: to find a curve that passes through two
given points while obeying the nonlinearities of the medium.
Groeller [1995] proposes several solutions to this problem: the first
one supposes that the light rays are only curved from the eye to the
intersection point, but travel in a straight line from the intersection
point to the light source. The second solution consists in assigning
color to the intersection point regardless of the light sources, for
instance by using textures with the illumination already
pre-calculated. These are obvious simplifications that will work well
for general image synthesis, but do not reflect the physics of the
system. The second solution is in fact used in [Ser�n et al. 2002],
since the authors concentrated mainly on solving the general equation
accurately. Another idea is to voxelize the space and get the
approximate direction of incoming light by shooting light rays through
the voxels from each light, saving the results in a pre-computed
structure. As far as the authors know, there is not much more
literature regarding this problem.
Since neither a pure backward, forward nor bi-directional ray tracing
solution seems viable for inhomogeneous media where rays get curved, we
sought a combined approach, creating a rendering environment named
Lucifer, based on photon mapping techniques.
Photon mapping is a two-pass algorithm [Jensen 2001]. In the first pass
photons are shot from each light into the scene, and traced as they
interact with the geometry. In each collision, the Russian Roulette
algorithm decides whether each photon is absorbed, reflected or
transmitted. When the photon hits a diffuse material, it is stored. The
data structure that stores all these photons is called the photon map.
The second pass consists on a modified ray tracing algorithm, but
instead of shooting shadow rays, radiance is estimated from the nearest
stored photons around the intersection point. Specular reflections are
obtained by standard ray tracing, since the probabilities of a photon
being reflected in the exact specular direction towards the eye are
infinitesimal.
The photon mapping algorithm allows a full global illumination
simulation, including color bleeding and caustic generation. As we are
going to see, it can also be adapted to inhomogeneous media, by
calculating the curved trajectory of the photons during the photon
tracing phase. This adaptation is what we refer to as curved photon
mapping.
3.1. Trajectory of the photons
The main
forte of Lucifer is its capability of providing a full global
illumination solution in inhomogeneous media, by accurately curving
both photons and eye rays as they travel through the medium. As a
starting point to obtain this curved trajectory of the photons, we take
Fermat�s principle [Glassner 1995], which can be formulated as �light,
in going between two points, traverses the route l having the smallest
optical path length L�. The optical path L is defined as the index of
refraction times the traveled path. In its differential form, it can be
written as dL=ndl. According to Fermat�s principle, the optical path
along a light ray trajectory must be a minimum, therefore  =0, where is given by:
(Eq. 3.1)
where xi are the components of l. Given that  , considering dxi as variables and taking increments we get
  so that equation 3.1 results:
(Eq. 3.2)
Since the different considered trajectories start in the fixed points A and B,  and
and  , so equation 3.2 results as follows:
(Eq. 3.3)
This equation must be true for any value of  ,
which lets us come up with the equation to obtain the trajectory of a
light ray in an inhomogeneous medium with a known index of refraction,
which is:
,
which lets us come up with the equation to obtain the trajectory of a
light ray in an inhomogeneous medium with a known index of refraction,
which is:
(Eq. 3.4)
where l is the length of the arc, n is the index of refraction of the medium and  with (j=1,2,3) are the coordinates of the point. If the index of
refraction is known for every point of the medium, we first calculate
that index and the slope of the curve at step i, advance
with (j=1,2,3) are the coordinates of the point. If the index of
refraction is known for every point of the medium, we first calculate
that index and the slope of the curve at step i, advance  along the direction of the tangent to reach step i+1, and calculate the
new index of refraction and tangent again. To calculate the direction
of the tangent we first obtain a numerical approximation by
discretizing the equation, effectively replacing differentials by
increments. We then apply the Richardson�s extrapolation algorithm to
select an optimal integration step for each instant, given an estimate
of the tolerable error. The process ends when we get to the
intersection point of the photon with an object, and gets started again
if the Russian Roulette algorithm does not absorb the photon at the
surface.
along the direction of the tangent to reach step i+1, and calculate the
new index of refraction and tangent again. To calculate the direction
of the tangent we first obtain a numerical approximation by
discretizing the equation, effectively replacing differentials by
increments. We then apply the Richardson�s extrapolation algorithm to
select an optimal integration step for each instant, given an estimate
of the tolerable error. The process ends when we get to the
intersection point of the photon with an object, and gets started again
if the Russian Roulette algorithm does not absorb the photon at the
surface.
Two maps are used in the current version of this technique: a caustics
photon map, to represent caustics in a more efficient way using
projection maps, and a second photon map to represent both direct and
indirect illumination, excluding caustics. We have named this second
map the diffuse photon map.
As a simple test scene we use a closed, square room with a cross-shaped
window in the left wall. A strong spotlight is placed outside looking
inside, so that most of its light enters the room through the
cross-shaped widow. Figure 3.1, left, shows the resulting illumination
when there is an extremely hot layer right below the ceiling of the
room. This makes the index of refraction inside the room a function of
height, thus creating an inhomogeneous media. Photon paths and rays are
curved according to equation 3.4. The resulting curved photon map can
be seen in figure 3.1, right.
The image was rendered at a 400x300 resolution, shooting 3.000.000
photons from the spotlight and using 150 photons for estimating the
irradiance. It took 4�47�� on a P-III @800Mhz and 512Gb of RAM, owed to
the time needed to calculate the curved paths. The error threshold when
using Richardson�s extrapolation algorithm was set to 0.01.
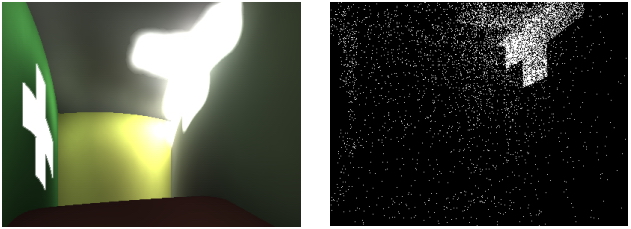
Figure 3.1: Test scene for the curved photon mapping algorithm. Left: resulting illumination. Right: the curved photon map used
4. Atmosphere profile manager
As we have
said, the atmosphere is an inhomogeneous medium with changing
parameters, like temperature or pressure. This is what causes some of
its optical effects, such as mirages or the green flash, and it is also
the reason why they can be seen only under certain, very specific
conditions. In order to simulate some of these phenomena, we then need
to have a model of the atmosphere that is versatile enough to be
adapted specifically for a desired effect.
Our approach to obtain an atmospheric profile is based upon the USA
Standard Atmosphere. It defines the pressure and temperature at
different heights, through empirical graphs and tables. In order to
obtain useful results to apply Fermat�s principle, a continuous
function is needed, as opposed to discrete data. We then obtain a
function through linear interpolation. The possibility of using some
other kind of interpolation (maybe quadratic) is being considered,
because some numeric methods to solve differential equations need not
only the function to be continuous but also its derivative [Burden and
Douglas Faires 1995].
Once we have an atmosphere profile, its density is obtained directly
from temperature and pressure using the Perfect Gas Law [Bruton 1996]:

(Eq. 4.1)
where  is the density we want to obtain, T is the temperature, P is the
pressure, M is the mean mass of the molecules of a mixed atmosphere (
28.96e-3 kg/mol typically) and R is the gas constant, 8.314510 J/mol�K.
is the density we want to obtain, T is the temperature, P is the
pressure, M is the mean mass of the molecules of a mixed atmosphere (
28.96e-3 kg/mol typically) and R is the gas constant, 8.314510 J/mol�K.
To include the fact that the index of refraction is also a function of
wavelength, we use Cauchy�s formula [Born and Wolf 2002]:
(Eq. 4.2)
where
a and b are constants which depend on the medium. In case of air a =
28.79e-5 and b = 5.67e-5. The Sellmeier�s approximation could also be
used instead [Born and Wolf 2002].
Now we have on the one hand density as a function of temperature and
pressure (which are a function of height themselves using the USA
Standard Atmosphere) and on the other hand the index of refraction as a
function of wavelength (equation 4.2). To obtain the refraction index
at any height and any wavelength we should combine both functions. We
can do so by applying the Glastone-Dale principle, which says that
refractivity (refraction index minus 1) is proportional to the density:
(Eq. 4.3)
All
the steps which have lead to equation 4.3 have been based so far on the
USA Standard Atmosphere, which does not provide the special atmospheric
conditions under which some phenomena can be seen. Any desired
condition, though, can be reproduced if instead of taking the initial
pressure and temperature values from the USA Standard Atmosphere we use
the specific pressure and temperature conditions that lead to the
phenomenon we want to reproduce, which can usually be found in the
literature.
In order to simulate the desired phenomena we need to modify this
Standard Atmosphere, obtaining modified atmosphere profiles from
initial parameters such as inversion layers [van der Werf et al. 2003].
To achieve this, we have created an atmosphere profile manager, from
where inversion layers can be appended to any given profile (usually
the standard) by the following analytical function, known as the Fermi
distribution:
(Eq. 4.4)
where x is the distance in the direction parallel to the Earth�s surface,  is the height of the inversion layer about which the added temperature profile is centered,
  is the temperature jump across the inversion and the diffuseness parameter a(x) determines the width of the jump.
5. Validation of the method
To validate
our approach this far we have designed several scenes, aimed at
mimicking some well-known or spectacular atmospheric effects, the green
flash amongst them. Photons were not used in these images to light the
scene. They were designed mainly to test both our method of resolution
of the curved trajectories and our atmosphere profile manager. We used
simple geometry combined with textures taken from real pictures, but
the sizes of the objects (sun, Earth�) and the atmosphere data are
taken from the real world, in order not to fake the effect. We consider
the properties of the atmosphere to be independent of x, since the
changes in that coordinate are usually small and can be neglected.
Considering a gradient also in that direction would enable us to
simulate some other phenomena, like the Novaya Zemlya effect [van der
Werf et al. 2003].
5.1. Mirages
There are two types of
mirages: inferior and superior. The inferior mirage occurs when there
is a decrease of temperature with increasing height. As a consequence,
the rays approaching the ground are curved upwards, generating an
inverted image of the object in the ground. Since the mirage image
appears under the location of the real object, the effect is known as
inferior mirage. This can typically happen when an asphalt road has
been overheated by the sun rays. The ground heated by an intense solar
radiation causes a pronounced heating of the air layers near the
ground. As a consequence of that temperature gradient, the index of
refraction increases with height and the rays become curved towards the
region in which the index of refraction is greater. Figure 5.1 shows an
inferior mirage on the road near the horizon. This has been obtained by
making the index of refraction in a particular portion of the road
lower than the rest, an effect caused by a local heating of the air
above the road.
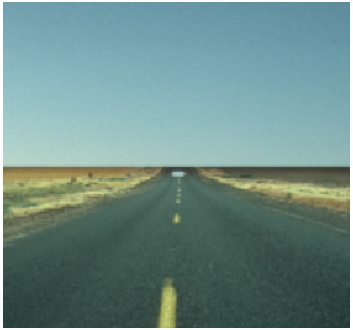
Figure 5.1: Inferior mirage on the road.
Superior
mirages occur when the temperature increases as the height increases,
which causes the light rays to be bent downwards. The image appears
above the position of the real object, therefore the effect is known as
superior mirage. These type of mirages happen usually at sea, when the
water is colder than the air above it.
5.2. Sunset effects
Other interesting
refraction phenomena occur during sunsets. The flattened sun is
probably the most common one, and happens when the atmosphere has an
index of refraction that decreases with height. It is so common because
usually the density of the air decreases as one moves away from the
Earth, and so the index of refraction decreases as well. As a result of
this, the sun is not seen as a perfect circle, but appears rather
flattened along the vertical axis. The rays become curved downwards,
towards the areas with a greater index of refraction, causing the
distortion of the sun. Moreover, the sun appears to be higher than it
really is.
The split sun is a curious phenomenon that may happen when there is a
cold air layer near the earth and a warmer layer above it. The
phenomenon of total reflection may take place when a ray passes from
one medium to another with a smaller index of refraction with an
adequate angle. In that situation there is no refracted ray, and the
ray is reflected. This configuration causes the split sun effect, with
two portions of the sun separated by an empty strip located around the
horizontal plane that passes through the observer.
The double sun phenomenon takes place when there is a very thin layer
of warm air over the surface of the earth. In this case, the rays
traced from the observer that do not make contact with the ground are
not affected by the warm layer and therefore the sun is perceived
without distortion. However, the rays which do make contact with the
warm layer become curved upwards. As a consequence, part of them
intersects again with the sun, thus causing the double image of the sun.
Figure 5.2 shows several images of the simulated sunset effects, along
with their real-world counterparts. The difference between the
simulated double sun effect and the real one is owed to the thickness
of the warm layer and the position of the sun relative to the observer.
Different combinations of these two parameters will give different
images based on the same double-sun effect.
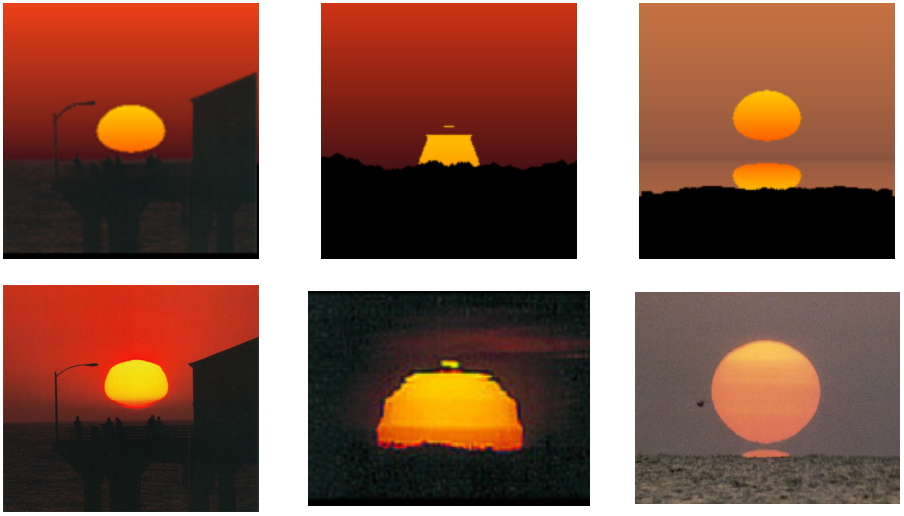
Figure 5.2: Simulated sunset effects and their real counterparts (flattened sun, split sun and double sun).
6. The green flash
So far, dispersion has
not been taken into account for the mirages and sunsets simulations,
since its effect in the phenomena is negligible. However, every
refraction phenomenon includes a certain degree of dispersion, and some
atmospheric refraction phenomena provoke a greater dispersion of light,
and the green flash is arguably the most spectacular of them all. As
our first step towards a complete simulation of the effect, we are
going to reproduce the so-called standard green flash, an effect that
occurs even in a Standard Atmosphere, taking refraction as a function
of wavelength.
The green flash is a very transitory effect, lasting only a few
seconds. When the sun is setting, and therefore it is low on the
horizon, the path that the light rays travel is longer. Since the
atmosphere is denser below than above, the light rays are bent
downwards, but because of the index of refraction being a function of
wavelength the blue-green rays are bent more than the red ones. The
result is that we see a blue-green rim on top of the solar disc, and a
red rim at the bottom. Aerosol extinction and Rayleigh scattering
[Preetham 2003] eliminate most of the blue from the top rim, thus
making the green purer. The red rim at the bottom is usually below the
line of horizon and cannot be usually seen, but the effect is
nevertheless known as the red flash. Figure 6.1 shows the simulation of
the green flash; there is a tiny green rim on the upper half of the
solar disk, and a tiny red one on the bottom side, occluded by the
horizon. A close-up of the picture allows us to better distinguish the
green on top of the solar disk. As the images show, the Standard
Atmosphere by itself produces a green flash about ten times smaller
than the eye can actually see. It can only be seen by the naked eye
when specific special atmospheric conditions that deviate from the
standard occur, creating mirages that magnify its appearance.
6.1. The human visual system: S�E�K�E�R
To
correctly display the images calculated in Lucifer, we then feed them
into S�E�K�E�R. This standalone application runs a tone reproduction
algorithm that maps images from real, calculated luminances to final
display luminances, while simulating several mechanisms of the human
visual system.
This application is based on the work of [Ward et al. 1997]. S�E�K�E�R
generates the adaptation luminances histogram of the HDR image and
modifies it to discover clusters of adaptation levels. Afterwards,
human visual limitation models are applied to simulate the effects of
the human visual system. Finally the image is mapped to match the human
contrast sensitivity.
We have followed two criteria to do a reliable tone reproduction: on
the one hand, it preserves visibility. That means that an object can be
seen in the image if and only if it can be seen in the real scene. On
the other hand, the image must induce the same subjective sensation in
the observer as if she were watching the real scene. The algorithm
reproduces the sensation of brightness, the visual acuity, contrast and
color perception, including the bleaching effect (see next section)
that makes the computed green flash greener.
6.2. Bleaching
What makes the green
flash specially interesting, from a Computer Graphics point of view, is
the fact that not only is the effect caused by the wavelength
dependency of the index of refraction (as opposed to the mirages and
sunsets presented before), but it is magnified by the human visual
system as well, through a process known as bleaching. This means that,
in order to simulate it properly, we need both a correct global
illumination algorithm for inhomogeneous media (validated in Section
4), and a model of the human observer that takes bleaching into account.
The human eye can undergo a loss of spectral sensitivity at moderate
and high light intensities which is referred to as bleaching. When
waiting for the green flash to occur, the retina has been exposed to
very bright red light for relatively a long time. That bleaches some of
the red-sensitive photopigments in the L cones (the long wavelength
cones). The amount of degenerated pigment (more precisely, a protein
known as rhodopsin) is proportional to the luminous intensity received
by the pigment. As more pigment is bleached, the effective pigment
density decreases and the spectral sensitivity becomes narrower,
although the wavelength of peak sensitivity is unchanged. This
degeneration has a great effect on our spectral sensitivity, and the
now less sensitive cones will perceive red as yellow, and yellow as
green. The effect has been previously studied in the field of Computer
Graphics by [Pattanaik et al. 2000], based on the model of color vision
of [Hunt 1995].
In the rods, the effects of bleaching on spectral sensitivity are
insignificant; instead, very small changes on rhodopsin density provoke
very large adaptive changes in rod sensitivity. This is usually a short
term effect, but exposure to very high levels, especially to the
shorter wavelengths, can lead to permanent vision loss, including
blindness.
In cones, on the other hand, the effects of bleaching on pigment
concentration can have large effects on spectral sensitivity and may
need to be taken into account when evaluating chromatic adaptation and
color matching.
Formulae are available for calculating the amount of photopigment
bleached for both long (equilibrium) and short duration bleaching
conditions. They rely on knowing the half constant of bleaching: the
intensity for which the percentage of bleached and unbleached pigment
is 50 percent. Estimates of this half bleaching constant have been
determined from fundamental reflectometry for the rods [Rushton 1972]
and for the combined M (medium wavelength) and L cones [Rushton and
Henry 1968]. Separate estimates of the half bleaching constant of the M
cones [Rushton 1963] and of the L cones [Rushton 1965] have also been
obtained, but they do not seem to be very accurate. A reliable estimate
of the constant of the S (short wavelength) cones has not been obtained
yet, although it is known that the S cones may be sensitive to photopic
damage, even at moderate levels of blue light [Harwert and Sperling
1971; Harwert and Sperling 1975; Sperling 1986].
Several studies have been completed to obtain the half bleaching
constant. According to [Rushton 1965], the long wavelength photopigment
is half bleached at retinal illuminance levels (amount of energy
entering the human eye) of 4.89 log trolands (td) in a ten-second
exposure, or at 3.8 log td in the steady state. Other studies come up
with 4.6 and 4.3 log td respectively, and suggest that a value of 6.1
log td (20.000 td) be adopted [Geisler 1978; Geisler 1979].
However, such values are based on adaptation to white or yellow lights
that bleach both M and L cones, so a light that bleached just one class
of cone would need to be only half as bright (10.000 td). In the case
of setting sun, where most of the energy reaching the eye falls in the
long wavelength side of the spectrum, the half bleaching constant for
the L cones will therefore be close to 4 log td [Walraven 1981]. We
will use that value for our simulation, since it also falls within the
ranges proposed by the studies mentioned.
As we have seen, retinal illuminances are expressed in trolands,
computed by multiplying the scene luminance by the effective eye pupil
area. Larger pupils admit more light. When the scene luminance is very
low, the diameter of the pupil can be as large as 7 mm, while at very
high luminances it may be as small as 2 mm. A good relationship between
pupil diameter and scene luminance is the equation recommended by
[Wyszecki 1982] (eq. 6.1). 
(Eq. 6.1)
The effective pupil area for estimating retinal luminance is less than
the actual pupil area because the relative contribution of light to the
sensation of brightness decreases as the light enters the pupil at
increasing distance from the center of the pupil. This is called the
Stiles-Crawford effect [Smith 1988]. It is a phenomenon of cone (or
photopic) vision and does not occur for rod (or scotopic) vision. It is
thought to be due to cone geometry. The ratio between effective and
actual pupil area is called the effectivity ratio, a quantity that
varies with pupil diameter and takes into account the Stiles-Crawford
effect. The effective pupil area is thus the actual pupil area times
this ratio R, expressed in the eq. 6.2.

(Eq. 6.2)
where
d is pupil diameter in mm. Estimated retinal luminance I (eq. 6.1,
expressed in trolands), taking R, the pupil area and the scene
luminance L into account, is:

(Eq. 6.3)
Having
obtained I plus the half bleaching constant, the following equation may
be used to approximate the effect of bleaching in the stationary state
[cvision.ucsd.edu]:

(Eq. 6.4)
where
p is the percentage of unbleached pigment; I is the intensity of
bleaching light, in trolands; I0 is the half bleaching constant , also
in trolands.
Now we need to know how this bleaching of the L cones affects
perception. To do so, we can use functions obtained from [Cornsweet
1970], that relate the perception threshold with the proportion of
pigment in bleached state (see figure 6.2). Bleaching the rhodopsin by
one percent raises this threshold by ten (decreases sensitivity by
ten). Figure 6.2 shows how bleaching 50 percent of the rhodopsin in the
rods raises the threshold by 10 log units while the same 50-percent
bleaching of cone photopigment raises the threshold by just about one
and a half log units. Therefore, rod sensitivity is not fully accounted
for at the receptor level and may be explained by further retinal
processing. It can be seen that the bleaching of cone photopigment has
a smaller effect on cone thresholds.
Figure 6.3, left, shows the result of applying this model of bleaching
to the image shown in Figure 6.1: all the yellow pixels have turned to
green, producing a thicker green rim. For the reader to better
appreciate the effect on printed paper, we have also added an image
indicating the pixels of the original image that have been made greener
by the bleaching algorithm (Figure 6.3, right).
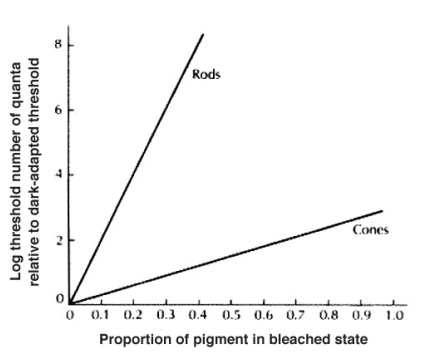
Figure 6.2: relation between perception threshold and bleached pigment (after [webvision.med.utah.edu])
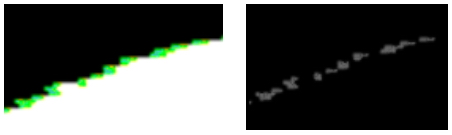
Figure 6.3: Left: Close up of the green flash with the bleaching algorithm applied. Right: Green pixels enhanced by bleaching
7. Results
Our approach to obtain a full
global illumination solution in inhomogeneous media is based on
exploiting the independency in the photon map algorithm between light
propagation (photon casting and tracing, first pass) and visibility
determination (ray tracing, second pass). This idea is implemented by
the curved photon-mapping algorithm. It works the same way than the
standard photon-mapping algorithm, but it can handle inhomogeneous
media as well by using Fermat�s principle and solving equation 3.4 to
obtain curved paths.
It is then also a two-pass algorithm: first, the path of each emitted
photon is curved as it is being traced throughout the scene, using
equation 3.4. Storing the photons (which paths have now been curved) on
diffuse surfaces follows the same process as though the photons had not
been curved.
During the second pass, the rays traced from the eye are also curved
using again equation 3.4. To account for direct illumination, no shadow
rays are shot towards the lights as in the original photon mapping
algorithm; instead, radiance is estimated by using the diffuse photon
map. This way, we avoid having to find the curved shadow ray that links
the intersection point and the light while obeying the nonlinearities
of the medium. We obtain the index of refraction as a function of
wavelength from standard pressure and height data, thus enabling us to
simulate dispersion effects.
We ensure the correctness of the method by using Fermat�s principle to
calculate the curved trajectories of the photons, generating several
test images that simulate mirages, sunsets and the green flash to also
validate the visual results. The atmosphere profile manager lets us
create the different scenarios rather quickly.
Finally, we have presented S�E�K�E�R, our standalone, tone reproduction
application that includes a model of the human visual system. More
specifically, the model of bleaching is being used in the simulation
the elusive green flash.
8. Future work
The results obtained so
far show the viability of the approach. As the system gets refined over
time, we nevertheless plan to generate better images that mimic some
more complex natural phenomena, such as ducting or the Novaya Zemlya
effect [van der Werf et al. 2003].
The green flash model obtained this far is purely standard, referred to
by some authors as �the textbook green flash� [Young 2000]. A more
complete model will be developed, taking into account also the mirages
that help magnify its effect in the real world.
We also plan to extend this work with volume curved photon maps, to
simulate other effects involving participating media, computing both
elastic and inelastic scattering. Possible areas of interest are
underwater imagery or driving simulators where the effects of fog need
to be accounted for while testing visibility.
Finally, given the fact that finding all the curved paths of both
photons and rays is computationally very expensive, optimization
strategies are specially important. Another line of future work to
reduce the rendering times implies the parallelization of the code to
be run on a Beowulf system.
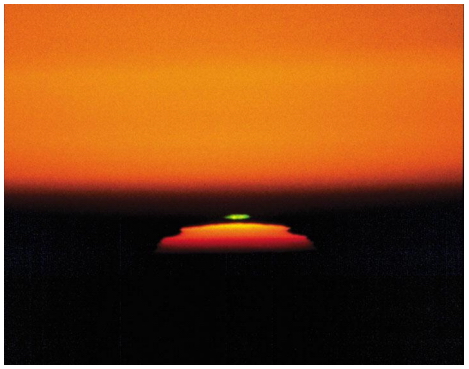
Figure 8.1: A picture of the green flash
Acknowledgements
This research was
partly done under the sponsorship of the Spanish Ministry of Education
and Research through the projects TIC-2000-0426-P4-02 and
TIC-2001-2392-C03-02.
References
ARVO , J.. 1986. Backward ray tracing, in Developments in ray tracing, ACM SIGGRAPH �86 Seminar Notes, volume 12.
BERGER, M. and TROUT , T. 1990. Ray tracing mirages, IEEE Computer Graphics and Applications, 11(5), may 1990, 36-41.
BORN, M. and WOLF, E. Principles of Optics: Electromagnetic Theory
of Propagation, Interference and Diffraction of Light. Cambridge
University Press, ISBN 0-521-642221, 2002.
BRUTON, D. 1996 Optical determination of atmospheric temperature
profiles, submitted to the Office of Graduate Studies of Texas A&M
University, 1996.
BURDEN, R. L. and DOUGLAS FAIRES J. 1995. Numerical Analysis PWS, Boston, USA.
CORNSWEET, T.N. 1970. Visual Perception. New York. Academic Press.
http://cvision.ucsd.edu
HARWERT, R.S. and SPERLING, H.B. 1971. Prolonged color blindness
induced by intense spectral light in reshus monkeys. Science, 174,
520-523.
HARWERT, R.S. and SPERLING, H.B. 1975. Effects of intense visible
radiation on the increment threshold spectral sensitivity of the rhesus
monkey eye. Vision Research, 15, 1193-1204.HUNT, R.W.G. 1995 The
reproduction of colour, Chapter 31. Fountain Press, England.
JENSEN, H. W. 2001. Realistic image synthesis using photon mapping, AK Peters, ISBN 1-56881-147-0.
LAFORTUNE , E. P. and WILLEMS, Y. D. 1993. Bidirectional path tracing. In Compugraphics �93, 95-104.
GEISLER, W.S. 1978. The effects of photopigment depletion on brightness and threshold. Vision Res., 18, 269-278.
GEISLER, W.S. 1979. Evidence for the equivalent background hypothesis in cones. Vision Res., 19, 799-805.
GLASSNER, A. S. 1989. An introduction to ray tracing, Academic Press Inc.
GLASSNER, S. A. 1995. Principles of digital image synthesis. Morgan Kauffman Publishers, Inc. ISBN 1-55860-276-3.
GROELLER, E. 1995. Nonlinear ray tracing: visualizing strange worlds, Visual Computer 11(5), Springer Verlag, 1995, 263-274
MINNAERT, M.G.J. 1993. Light and color in the outdoors, Springer-Verlag 1993.
MUSGRAVE, F. K. 1990. A note on ray tracing mirages, IEEE Computer Graphics and Applications, 10(6), 1990, 10-12.
MUSGRAVE , F. K. 1993. Methods for realistic landscape rendering, PhD. Thesis, Yale University.
NISHITA ,T. 1998. Light scattering models for the realistic
rendering of natural scenes, Proceedings of rendering Techniques �98,
1-10.
PATTANAIK, S.N., TUMBLIN, J., YEE, H. and GREENBERG, D.P. 2000.
Time-dependent visual adaptation for fast realistic image display. In
ACM Proceedings 2000. ACM Press, 2000.
PREETHAM, A.J. 2003 Modeling Skylight and Aerial Perspective. ATI Research, ACM SIGGRAPH 2003
RUSHTON, W.A.H. 1963. The density of chlorolabale in the foveal cones of a protanope. Journal of Physiology�63, 168, 360-373.
RUSHTON, W.A.H. 1965. Cone pigment kinetics in the deuteranope. Journal of Physiology�65, London, 176, 38-45.
RUSHTON, W.A.H. 1972. Pigments and signals in colour vision. In Journal of Physiology�72, London, 220, 1-21P.
RUSHTON , W.A.H. and HENRY, G.H.. 1968. Bleaching and regeneration of cone pigments in man. Vision Research 8, 617-631.
SER�N, F.J., GUTI�RREZ, D., GUTI�RREZ, G. and CEREZO, E. 2002. An
implementation of a curved ray tracer for inhomogeneous atmospheres. In
ACM Transactions on Graphics, 2002.
SMITH,V.C., POKORNY, J. and DIDDIE, K.R. 1988. Color matching and
the Stiles-Crawford effect in observers with early age-related macular
changes. Journal of the Optical Society of America A, Volume 5, Issue
12, 2113-December 1988.
SPERLING, H.G. 1986. Intense spectral light induced cone specific
lesions of the retina and the effects of anesthesia. In Hazards of
Light eds. Cronly-Dillon, J.R. et al., pp. 153-167. Oxford: Pergamon.
STAM , J. and LANGUENOU, E. 1996. Ray tracing in non-constant media. In Proceedings of Rendering Techniques �96, 225-234
VAN DER WERF, S. Y., G�NTHER, G. P. and LEHN, W. H. 2003. Novaya
Zemlya effects and sunsets. Applied Optics, Vol. 42, No. 3, 20-1-2003
VEACH , E. and GUIBAS, L. 1994. Bidirectional estimators for light
transport. In Fifth Eurographics Workshop on Rendering, 1994, 147-162.
WALRAVEN, J. 1981. Perceived colour under conditions of chromatic
adaptation: evidence for gain control by mechanisms. Vision Res., 21,
611-630.
WARD, G., RUSHMEIER, H. and PIATKO, C. 1997. A visibility matching
tone reproduction operator for high dynamic range scenes. IEEE
Transactions on Visualization and Computer Graphics, 3(4), pp. 291-306.
October-November 1997
http://webvision.med.utah.edu
WYSZECKI, G. and STILES, W.S. 1982. Color Science: Concepts and
Methods, Quantitative Data and Formulae. John Wiley and Sons, 2
edition.
YOUNG, A.T. 2000. Visualizing sunsets III. Visual adaptation and
green flashes, Journal of the Optical Society of America A, vol. 17,
pp. 2129-2139. December